


Dynamic 🔌 Cables Ltd - A Deep(ish) Dive

Dynamic Cables (DCL) business model is highly dependent on Raw Materials such as - Aluminium, copper & Rubber.
After all a cable is simply made of 3 parts: conductor (Copper/Aluminium), insulation (metal/rubber) and the Jacket (Rubber)

(#1) Gross Profit margins reflect DCL’s ‘high-dependency’ on RM prices, which are at all-time highs anyway. You can read this article I wrote on Copper (later ;)

Put another way, with a measly 15-20% GPM, the co’ can barely charge above the cost of the Raw Material. On top of that, any sharp fluctuations can impact margins.

Even in comparison to other players, some bigger, some smaller than DCL, RM as % of Sales seems on the higher side consistently. However, the reason for the same is yet to be determined

Given low GPM and fluctuating RM Prices, ‘pricing power’ seems to be a distant dream for the co’.
Although, that is an industry norm, not a predicament faced only by DCL.
Except maybe some of the larger players, which have better (not exceptional) ability to pass on RM prices given their higher retail (B2C) focus & higher bargaining power (size matters), most players in the Industry supply on a ‘Firm Prices contract’ i.e - Between the time you get an order and you supply it, if RM prices move, it’s your problemo!

There are 2 ways in which DCL tries to protect itself from adverse RM movements :
Hedging RM Prices
Places RM orders only post receiving Order from Clients
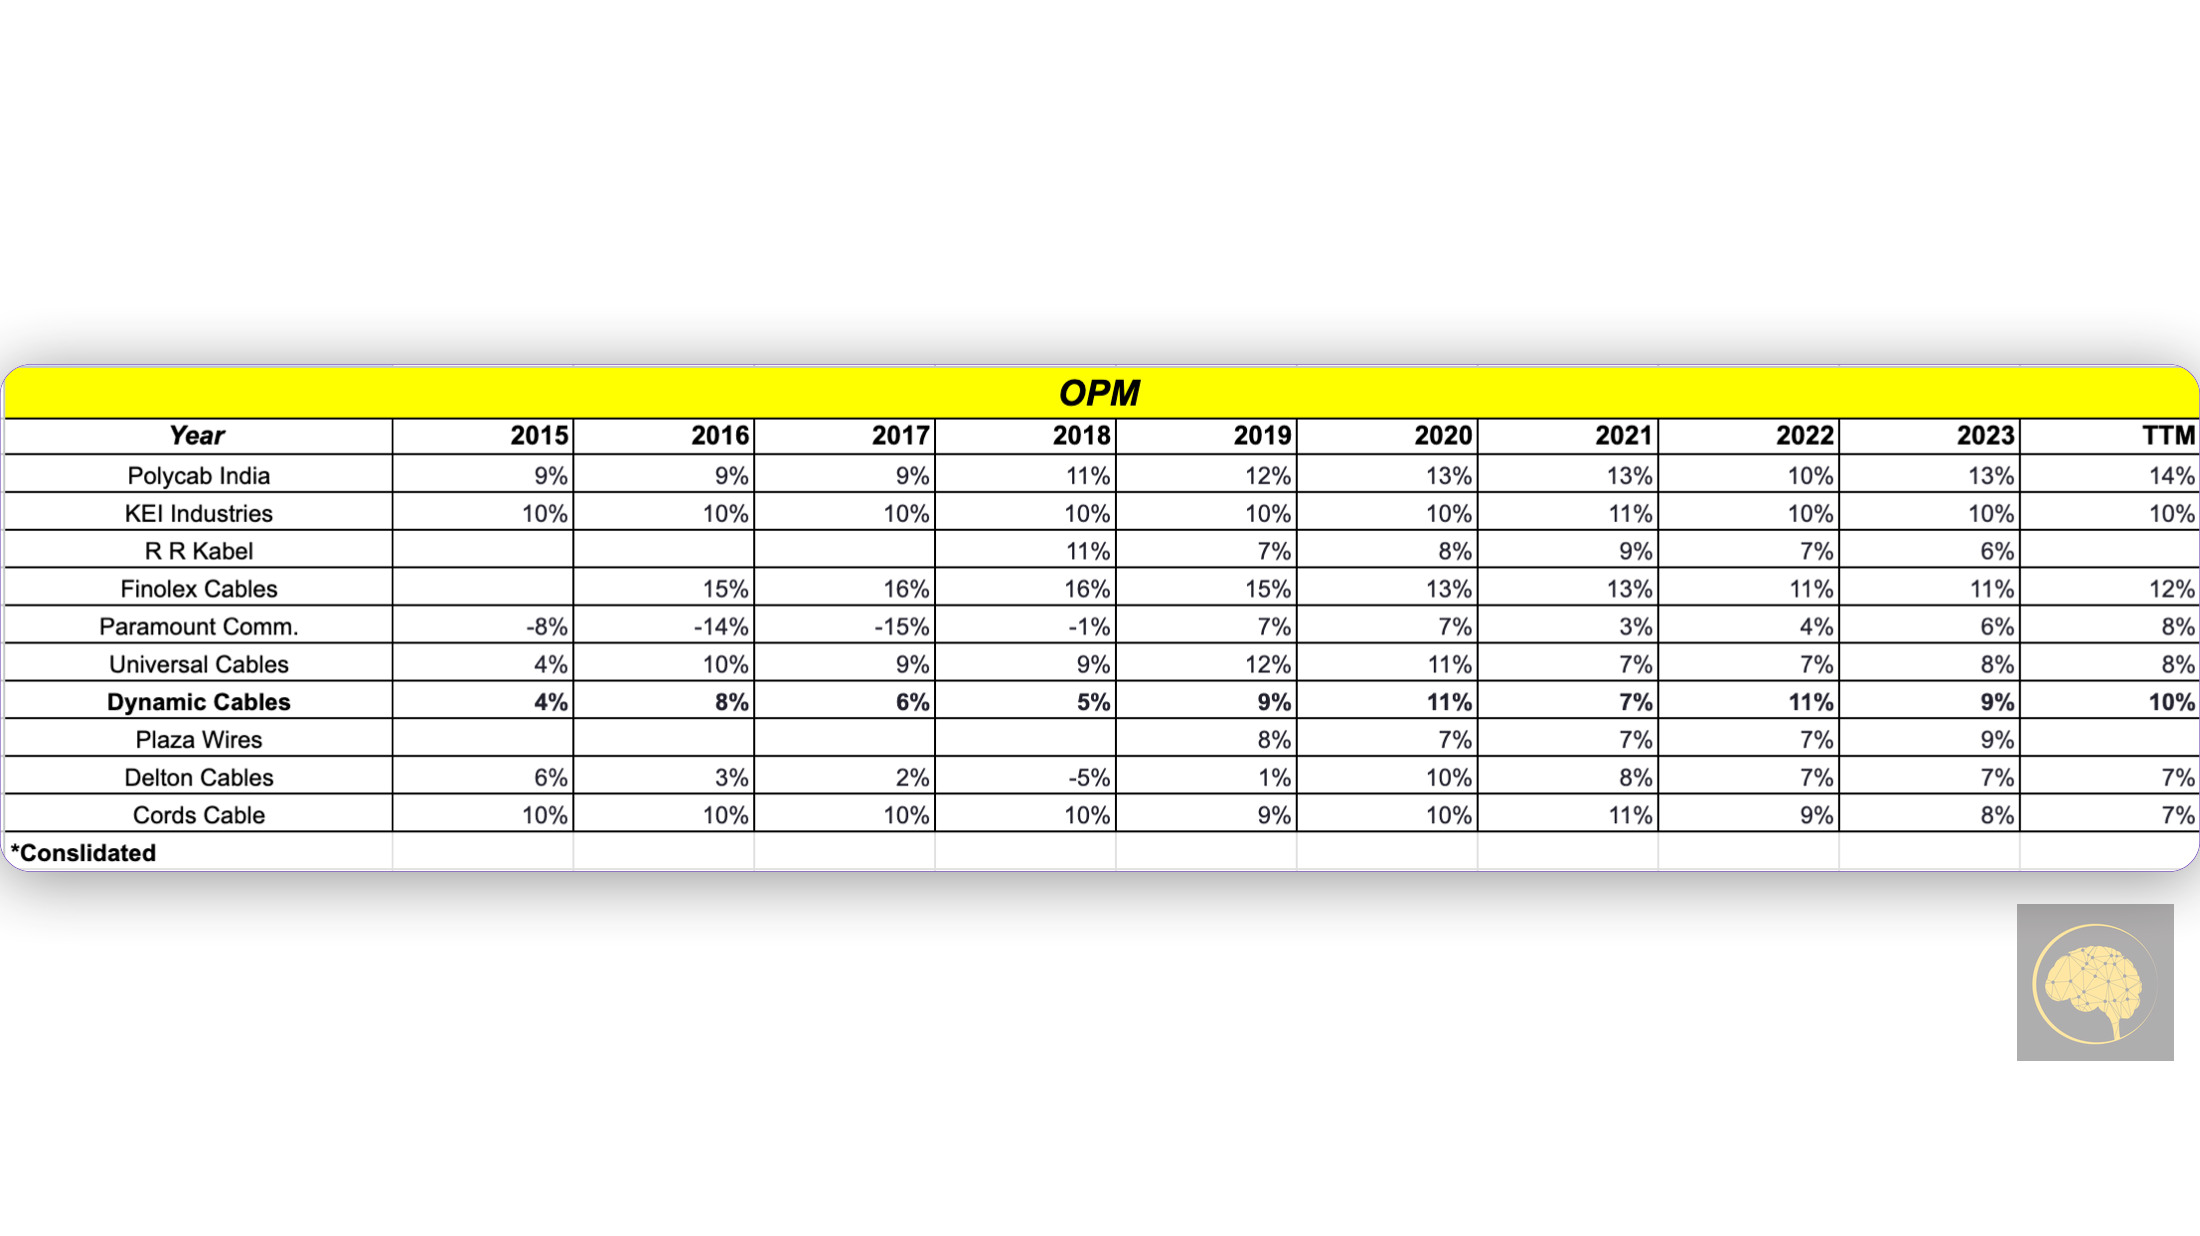
Despite higher than normal GPM, DCL’s (#2) Operating Profit Margins (EBITDA %) seem to be in line with expectations: Lower than the larger peers but higher than the smaller peers.
#3 - Product Mix
~ 63% of the Sales (FY23) came from HV Cables (Higher margin) and the remaining ~27% from LV Cables.
DCL has increasingly shifted towards higher margin HV cables over the last 5 years. It has also reduced reliance on Government business.

A likely outcome of the above 2 strategic shifts is that :
EBITDA Margins have improved from ~5% to ~9-10%
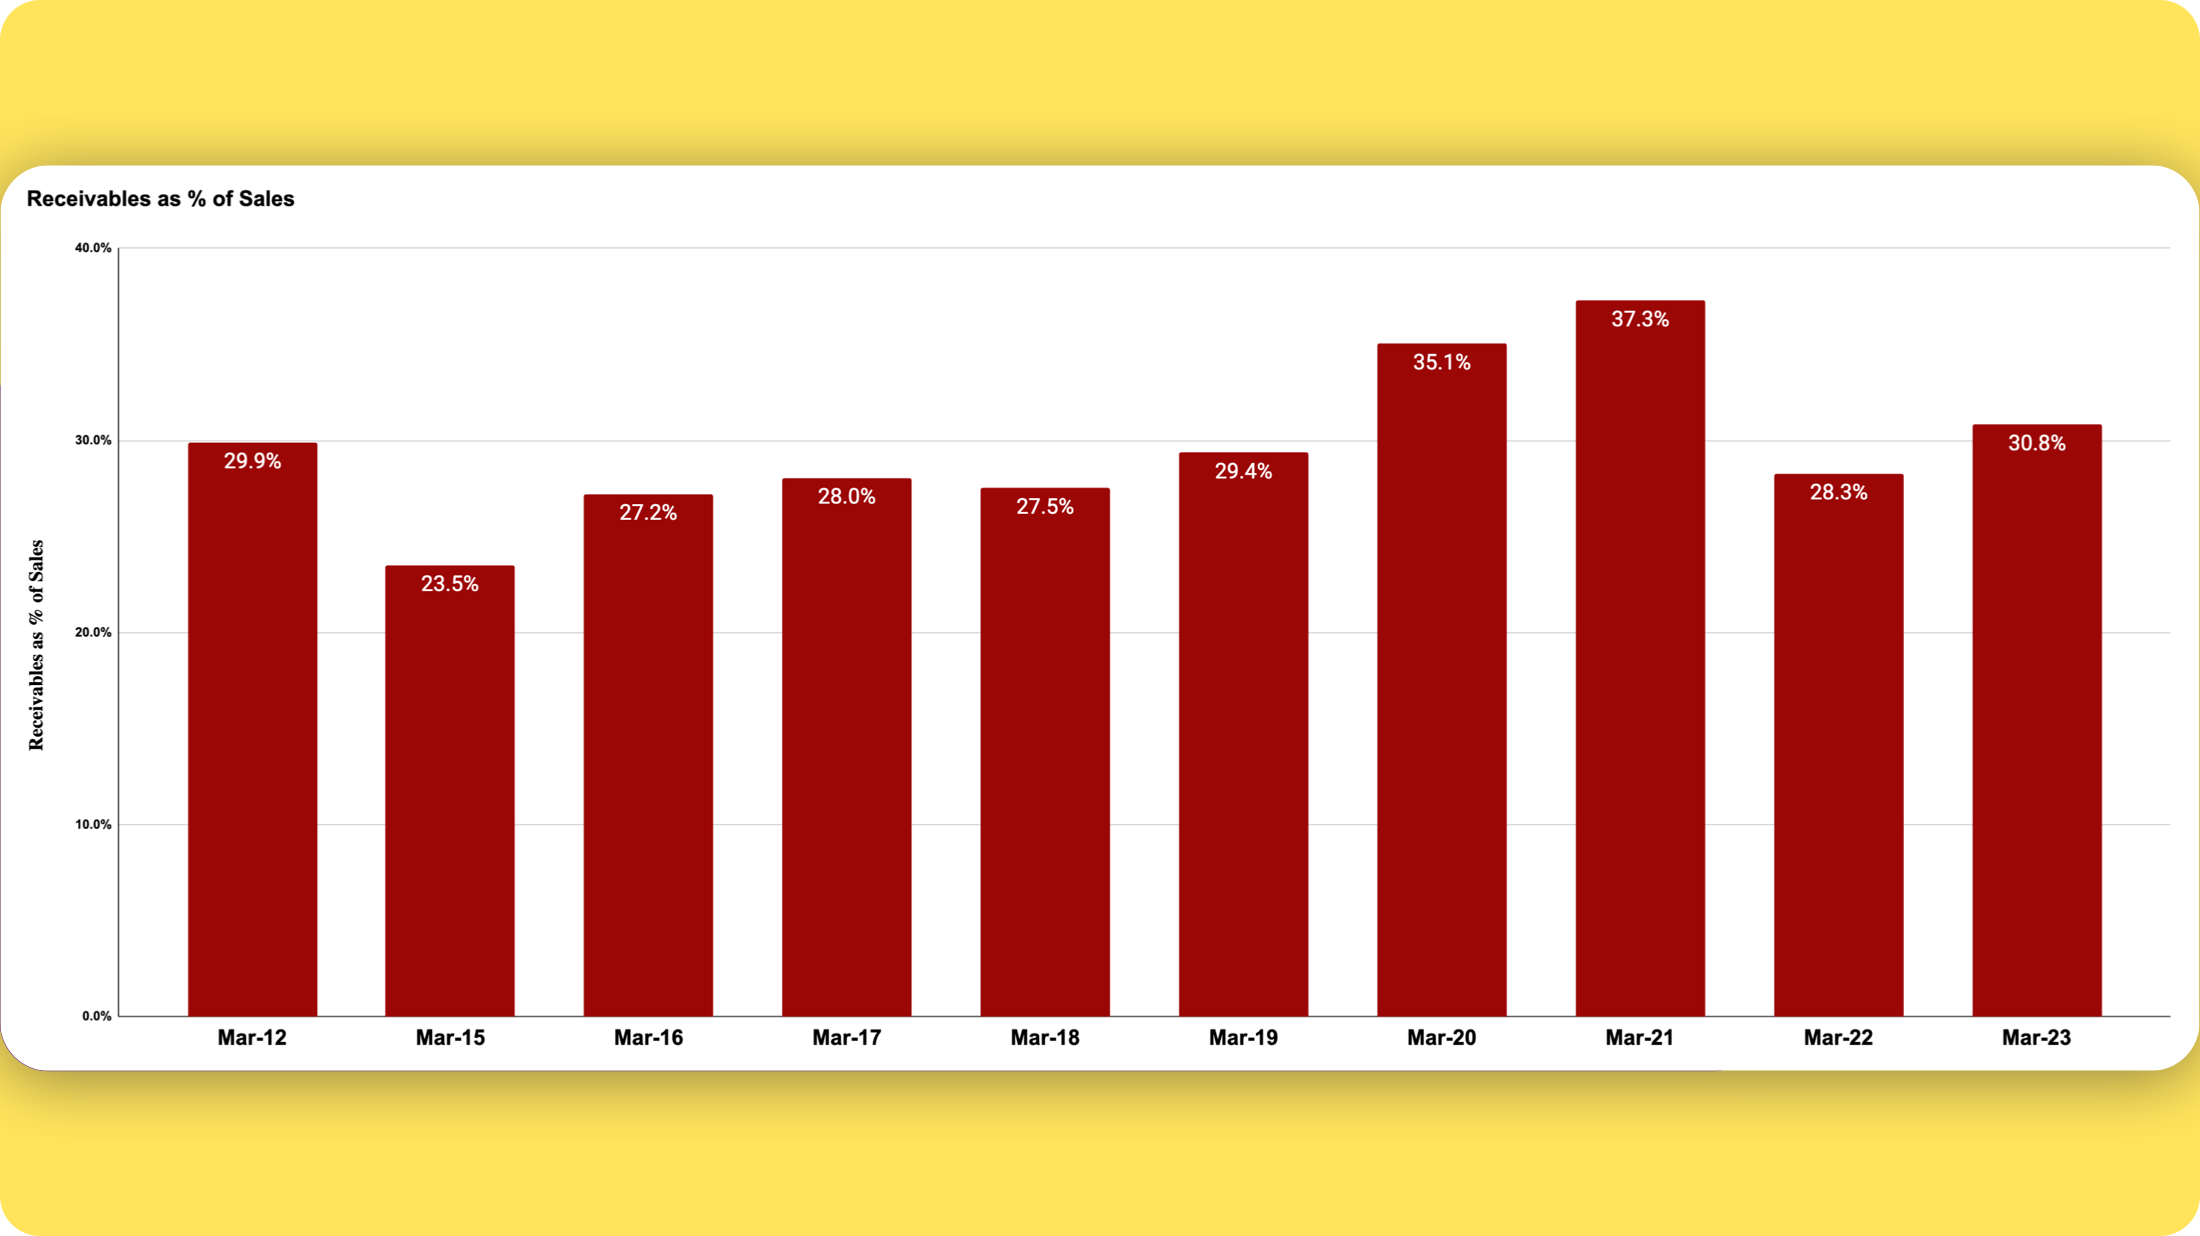
Cash Conversion cycle has improved from 124 Days in 2018 to 83 days in 2023. But this is a result of increasing payables (taking longer to pay suppliers), not of decling receivables days.

In fact, Receivables as a % Sales have increased over this period.
Therefore, shifting away from Government orders may have other benefits but shortening receivables cycles is not one of them.
Going forward co’ is betting on HV cables & Railway Signalling Cables to contribute to growth.
#4 - Capacity
Current Capacity can generate sales of 800-1000 cr (AR - 2023) with marginal capex.

Additionally, Co’ has invested 20 Cr in FY24 to increase capacity by 22-25%

This brings Revenue potential to ~ 1000 - 1200 Cr ( Expected FY24 @ 780 Cr)
A simple model with some basic estimates suggests over the next 3 years if Sales grow by 20% YoY, we’re looking at a PAT of 45-50 Cr.
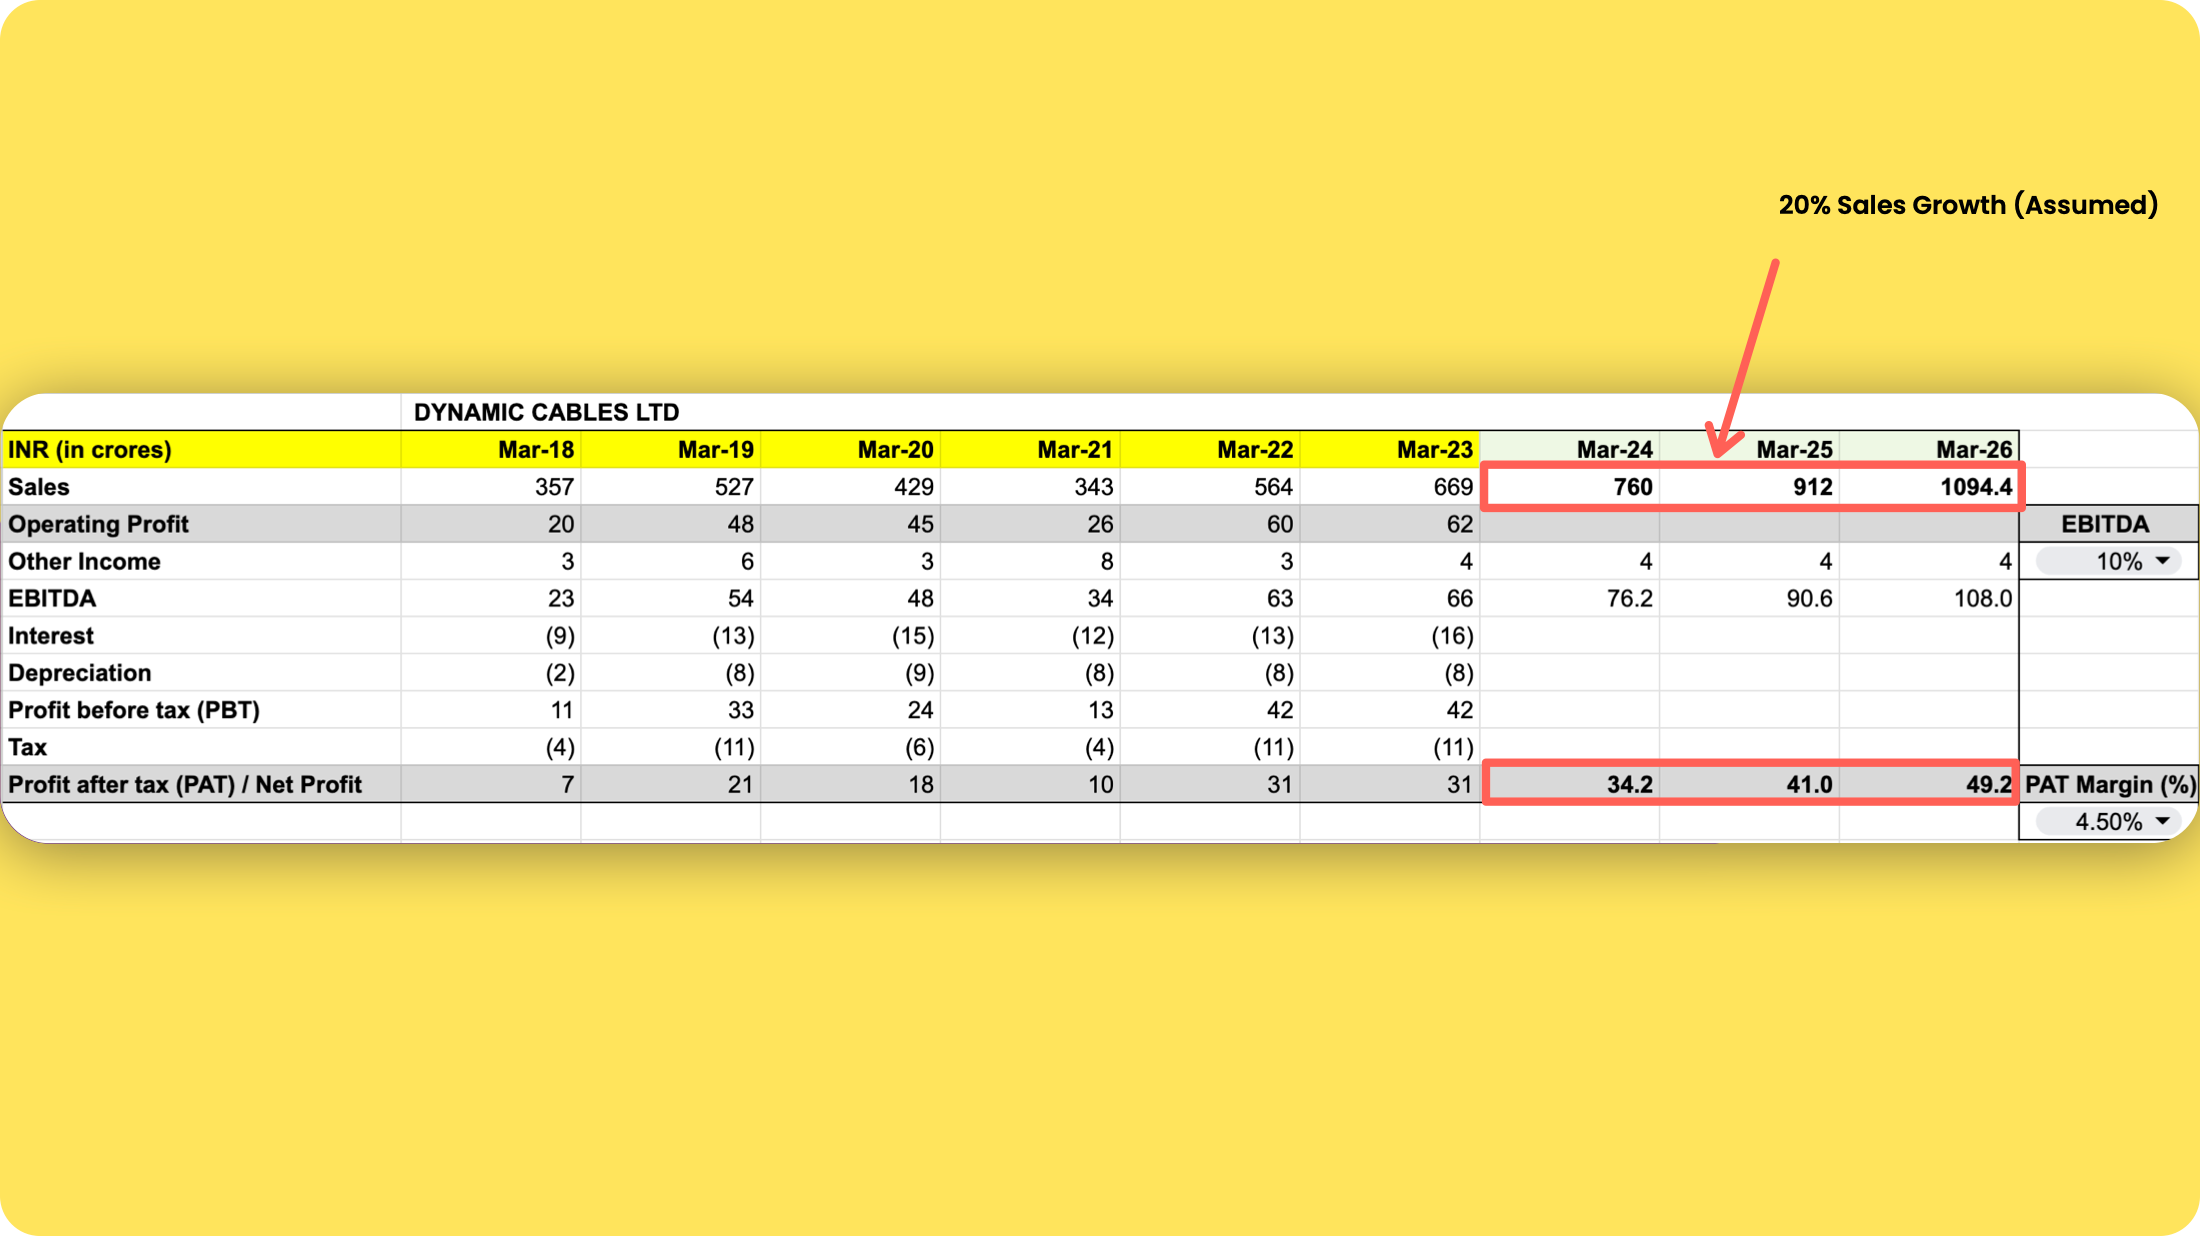
If multiple remains the same, the co’ might become a ~1500 Cr Company (currently 1000 Cr). This is hardly enticing but I’d say this is the base case.
The question is: can the co’ grow at 20%+?

Even if Sales Growth is lower than 20%, there 2 possible levers that can lead to a 20-25% PAT Growth :
EBITDA Expansion - Unlikely (unless co’ decides to focus on retail in which case it is going to require upfront investments in brand building)
Improving Working Capital - Unlikely (If Interest cost reduces as a % of Sales, it could boost PAT, however, most of the interest cost is derived from Working capital Loans and WC/Sales has been fairly consistent at around ~30% with no imminent reason for improvement at this point)

Ignoring the Covid-inflicted period, there seems to be a downward trend in Working Capital / Sales (%) which means lesser WC Debt and lower Interest cost and higher PAT. Can it go lower, remains to be seen.
The most reliable growth trigger is 🏭 capacity Expansion. Let’s see how this plays out. This is NOT a Recommendation/Advice, please read the Disclaimer.
In Conclusion, there seem to be limited triggers (Currently) for Dynamic Cables that can help the co’ achieve a 20-25% PAT Growth.
UPDATE : 13th May 2024
The Management has decided to go for a Fund raise (Rumoured amount is ~100 Cr (Not official)) and this should give the much needed funds to expand Capacities.

And given the relative undervaluation to other Power Cable companies (Read : Quantitive Analysis of Power & cable Companies), market has reacted very very favourably to the news. The stock is up 20% today !

Would like to hear your thoughts in the comments.
Thank you
Rahul
DISCLAIMER :
I am NOT a SEBI - REGISTERED Investment Advisor | Nothing you read here should be construed as investment advice. I do not know your circumstance so please treat the above as nothing more than my personal opinion, which is subject to change without prior notice to you. Please do your work and consult your financial advisor. I may own positions in all stocks, sectors and indices discussed and can exit them without notice
hi rahul, any idea what is the average cost of setting up a wire and cable manufacturing plant? it appears that the fixed asset turnover ratios in this business are quite high - evident from the dynamic cables AR snippet wherein 20 cr capex results in incremental revenue of 200 to 400 cr. (10-20x or maybe even higher if the 20 cr includes land purchase). However, please can you confirm my understanding of the economics of this business. Turnover ratios using P&M values for the big 4 (polycab, kei, finolex and rr kabel) hover around 12x. i.e. for 100 rs of capex (assuming leased land), one can achieve 1200 rs of revenue. with EBITDA margin % of ~8% (assuming 10% less 2% cost of leased land), working capital requirement at ~75 days of 250 rs. so one can earn ~72 rs. post-tax (25% assumption) on a capital of 350 rs. i.e. a ROE of 21%. add in some leverage for working capital and this will expand further. how is a commoditized business so profitable? what am i doing wrong?