


Is 'Raymond Lifestyle' the Next Big Value Bet?
or just another 'fooki bomb' 💣

Disclaimer : No Holding Anymore.
Raymond Lifestyle Ltd (RLL) was listed on 5th September 2024. It was spun off from Raymond Ltd. The OG (original) Raymond Ltd.
If ‘Chor bana mor’ had a poster child, Raymond would be a top contender.
Not because I think Raymond Ltd is ‘Chor’ but because at least since 2015, its reputation has been marred by an internal conflict between the father – Jaypat Singhania and son - Chairman & CEO – Gautam Singhania.
8-9 years of bad press doesn’t help your reputation !

Weird thing is that I don’t really know what happened, but somehow I “believe” that they have severe corporate governance issues. Strange how our beliefs our formed.
Believing without “knowing the facts” must be questioned. In recent experience, such “belief” deterred me from what was possibly one of the great bets within my so called ‘circle of competence’ - Public Sector Banks.
Fortunately, I rectified this error with Suzlon when everyone “believed” that Suzlon was crap.
As for Raymond, it has been special situation at least for 10+ years before it finally became one.
Value Investors in their search for ‘hidden gems’ have stumbled upon the company, looked at their 100 Acre land parcel, and excitedly told their Investor friends about it. In many cases taken a position, only to be disappointed.
My initial thought was because of these Corp Governance issues; Raymond Stock would have been largely flat through most of the last 10 years. How wrong I was.
In the last 14 years or so, there were at least 4 opportunities when the stock either doubled or more than doubled, on one occasion it even went up by more than 4X. But that’s hindsight.
For example in April 2016, it had sales of 5000 Cr and was trading at Market cap of ~ 2500 Cr. In the next 2 years, it more than doubled.
The assumption is that one could’ve predicted/bet on those moves and profited. I did NOT.
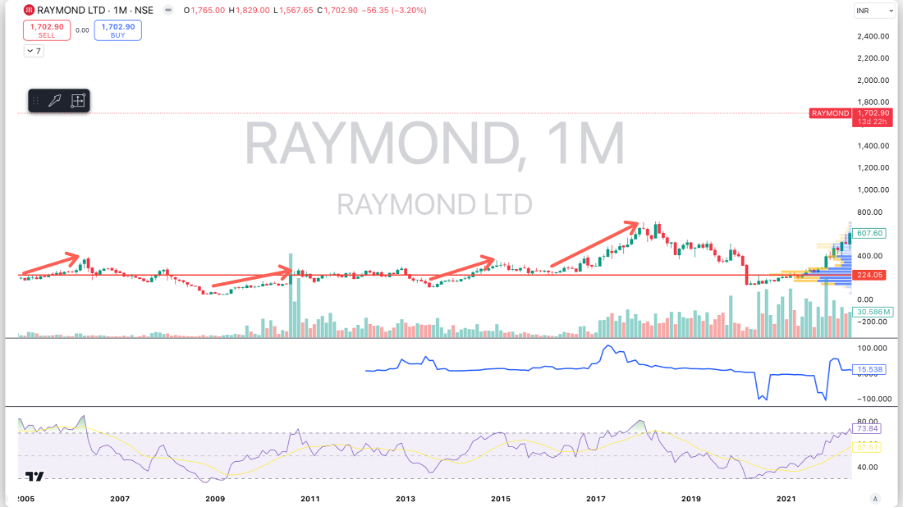
Another way to look at the chart would be : Price was flat between 2007 and 2021. Perspective matters, your strategy matters, your time horizon matters.
Another takeaway: Poor Corporate Governance has levels. From outright fraud to siphoning off some money to shareholder unfriendliness to accounting agressiveness. The Raymond Ltd chart highlights that despite (or because of?) Corp governance issues, opportunities still exist.
Maybe this is a bull market and it’s easy for me to say what I just said, maybe in a bear market I will look back and regret my words. The larger point is that Management dishonesty lies on a spectrum. It’s not black or white.
Rant over.
Coming back to De-merger.
The proposal to de-merge appears on screener.in records as early as July 2019. On 7th November 2019, the company outlined a proposal for the terms of the demerger.
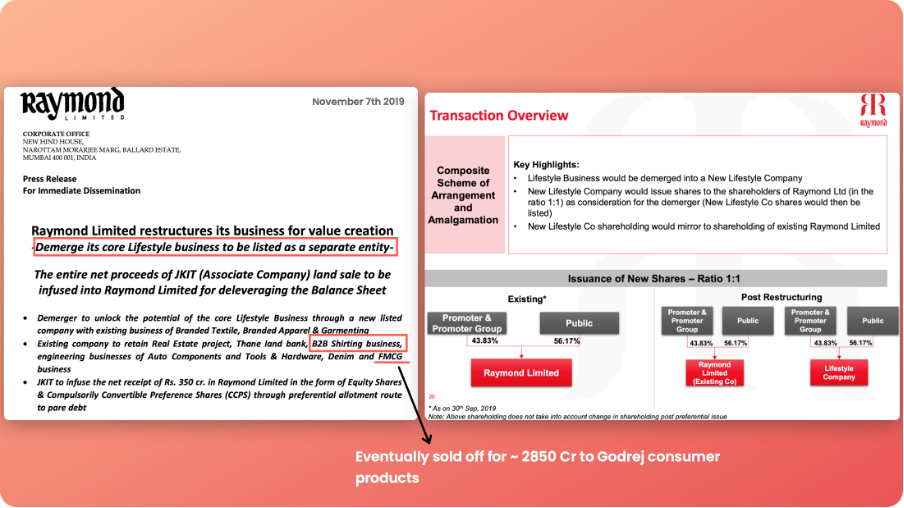
So one thing is clear, even the “special situation” or “value unlocking” was long time coming. It wasn’t until FY23 when the sale of the FMCG Business for 2850 Cr materialized. Which by the way was not part of the plan originally.

Coming out of Covid all segments were seen firing on all cylinders (more on this later), margins were improving, non-core FMCG business was sold, Real Estate was doing really well and the core Raymond Branded textiles/apparel was demerged etc. There were quite a few “Triggers”, not to mention a buoyant market.

This reflected in the stock price, way before the demerger actually happened (Duh)
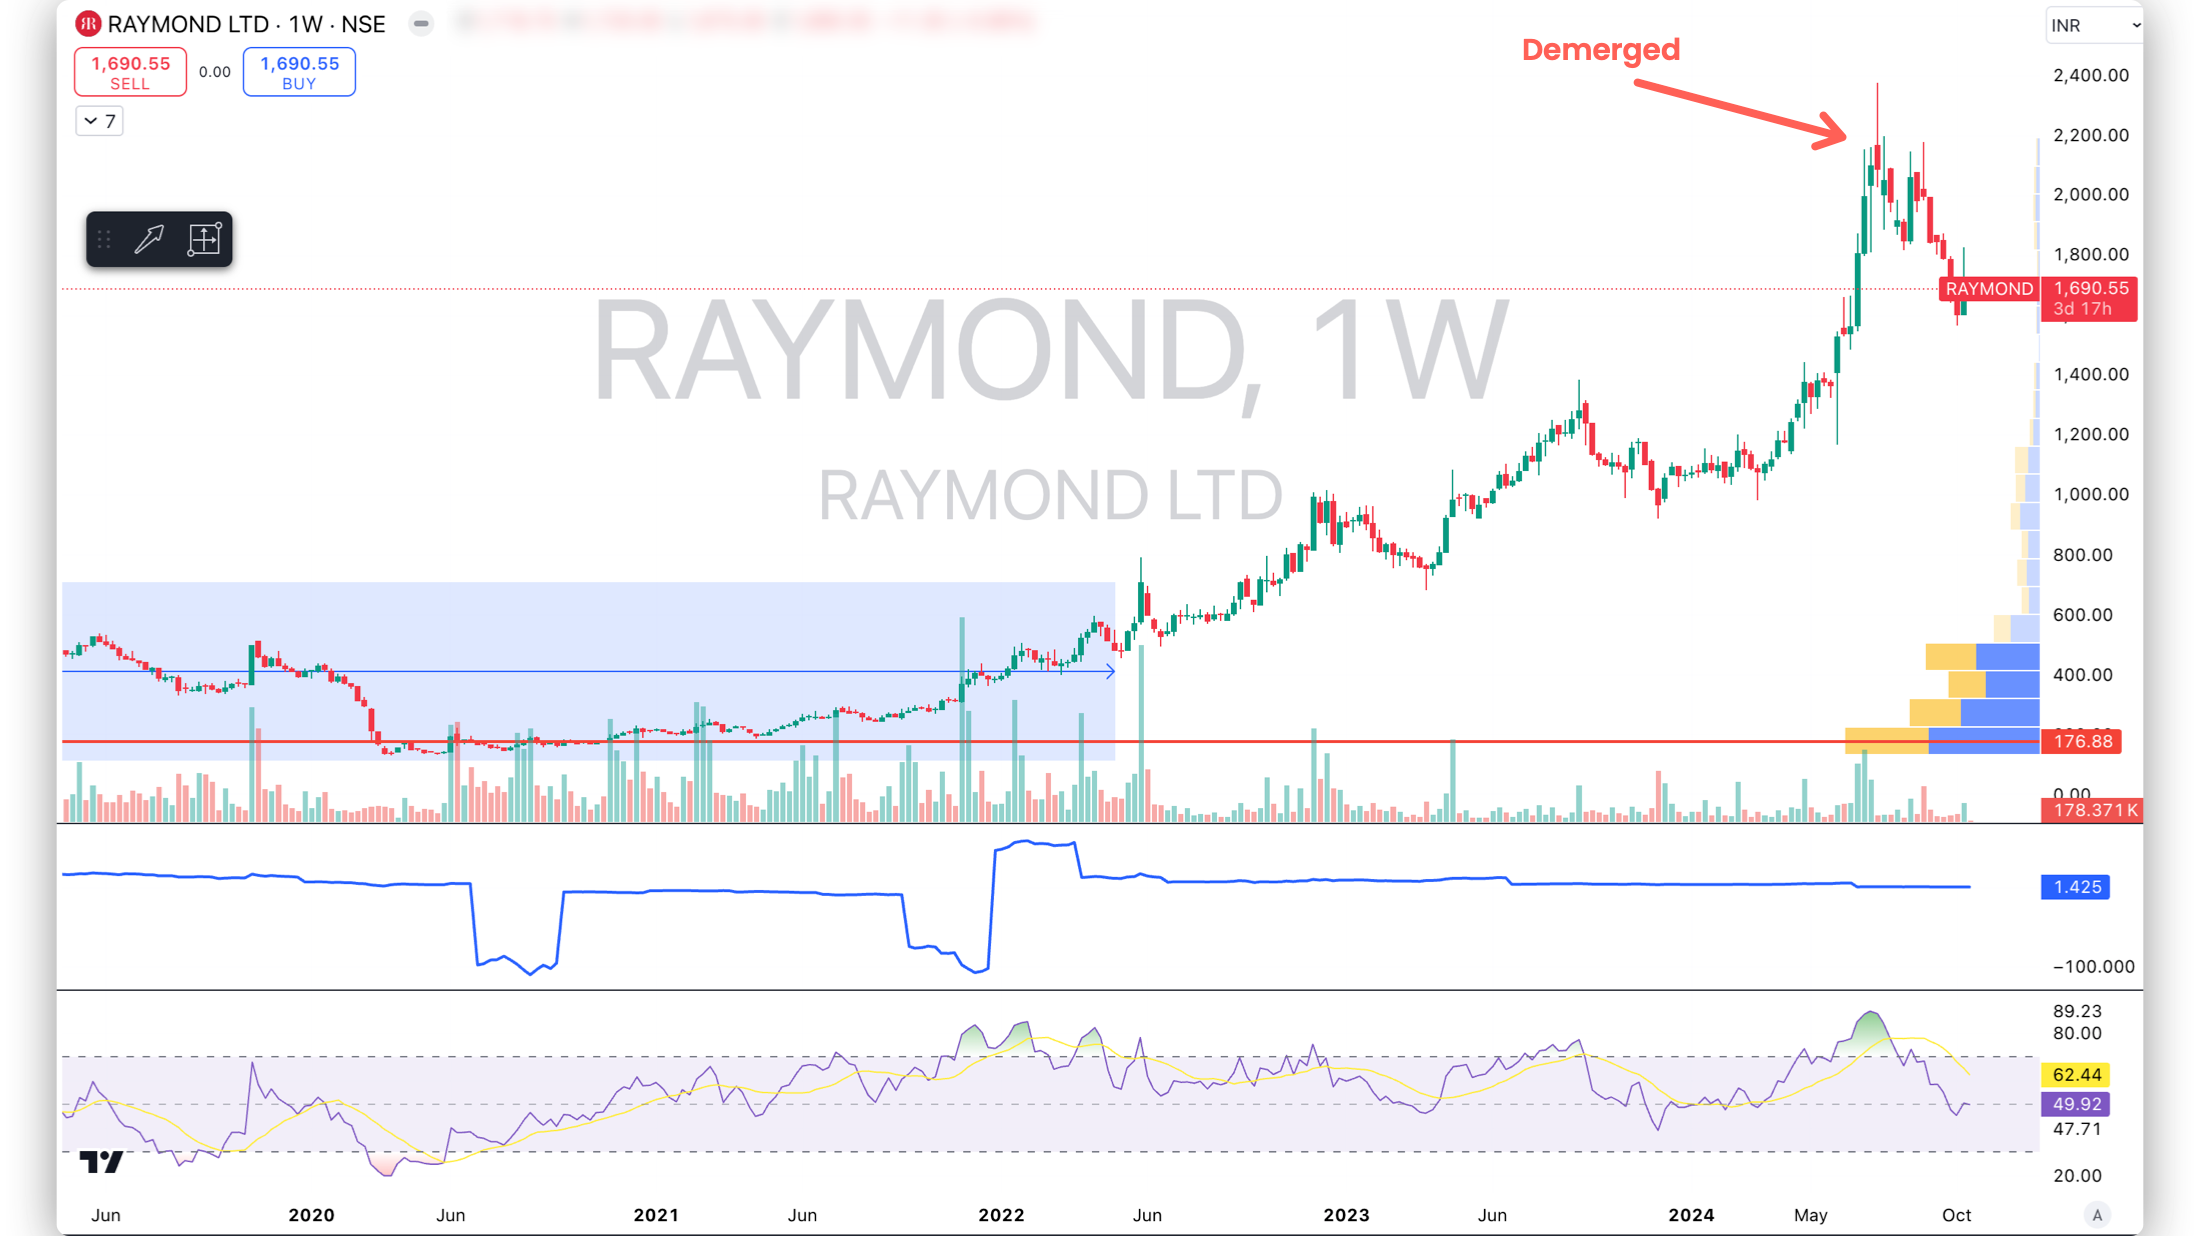
Shareholders approved the demerger of Raymond Lifestyle (core business) from the Raymond Ltd on July 2024. The resulting structure was:

On September 5th Raymond Lifestyle was listed. Usually, this process takes 12-15 months, but they hacked it in Less than 2 months.
(FYI…I have a course on Banking/NBFCs. Please consider joining. It helps support my writing ;))

Demerger Dynamics
September 2024 Shareholding data of Raymond Ltd showed 22.97% of the shareholdings was held by DIIs & FIIs.
The beauty of a demerger is that when a smaller company is carved out, the first thing that happens is that a certain set of shareholders exit the newly listed company.
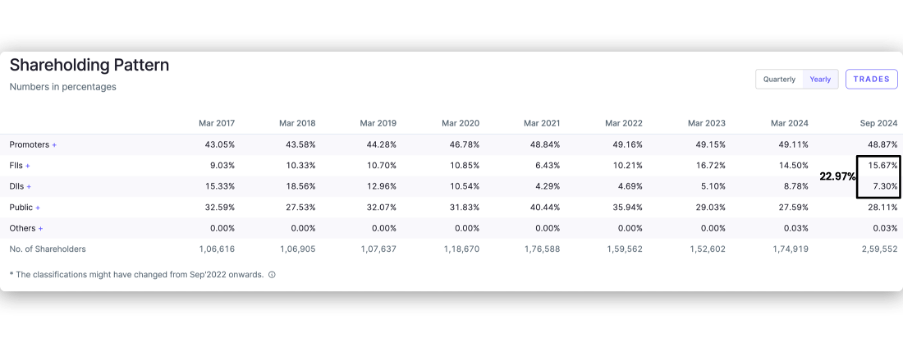
Sometimes, the company is too small to fit the mandate of a particular fund. Sometimes, the fund just wants to realize a profit, sometimes, it’s an Index fund which basically sells without discretion to whether the newly listed business is good, bad, ugly or whatever.
All this leads to ‘indiscriminate selling’. Stock gets beaten. No mercy. This creates opportunity for other sets of investors. That’s what we’re going to talk about next.
The Fund Flow Angle
Funds in Green are those that added to their holdings in September 2024. Those in yellow maintained their shareholding. Funds in red sold. Those that entered afresh, are marked in Blue.

Without exception, ever single fund that sold was an Index fund/ETF - NIFTY smallcap 250 etc. They sold because, well, decision on which index it will be a part of is yet not taken.
In the case of NSE, it’s subsidiary - India Index Services and Products (IISL) decides which stocks are included or excluded from the Nifty Index. The details are shown below.

Since the re-balancing happens semi-annually and the cut off – July 31st has passed, the decision on whether RLL would be included in small cap 250 will be taken based on January 31st 2025.
On that date, it is very likely to be included once again in Smallcap250. Why?
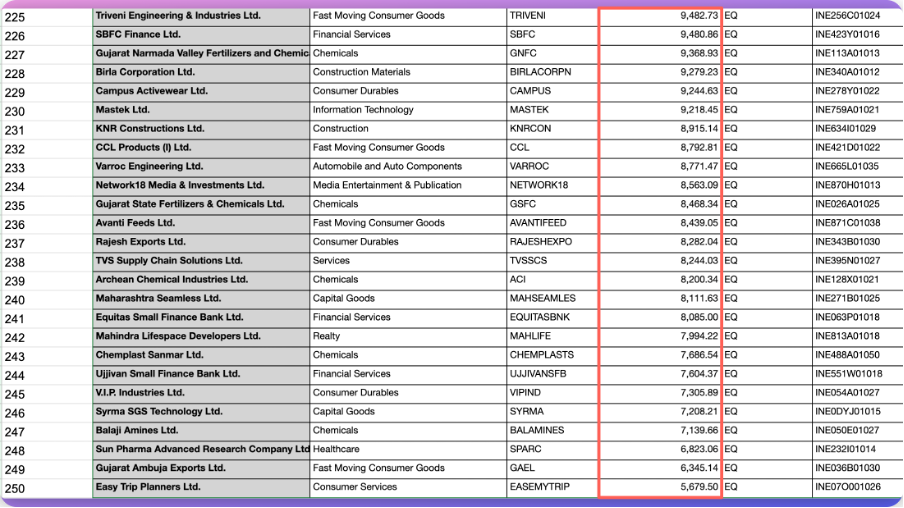
Because it’s current Market Cap is higher than the bottom 25 companies in the Smallcap250 Index. Of Course, market cap of these companies is constantly moving but its very likely RLL will find a place in the smallcap250 index.
This is a ‘fund flow’ angle. Personally, I would not be keen (never say never) to invest solely on that reasoning. There must be an underlying economic perspective for me to get comfortable with Investing in such ideas. This brings us to the tricky bit – Current valuations and future prospects.
Valuations
I’ve read a few articles highlighting EV/EBITDA multiple of RLL. The table usually shows a bunch of garment/apparel companies and their respective EV/EBITDA and in relation to them, RLL’s multiple.
For Example.
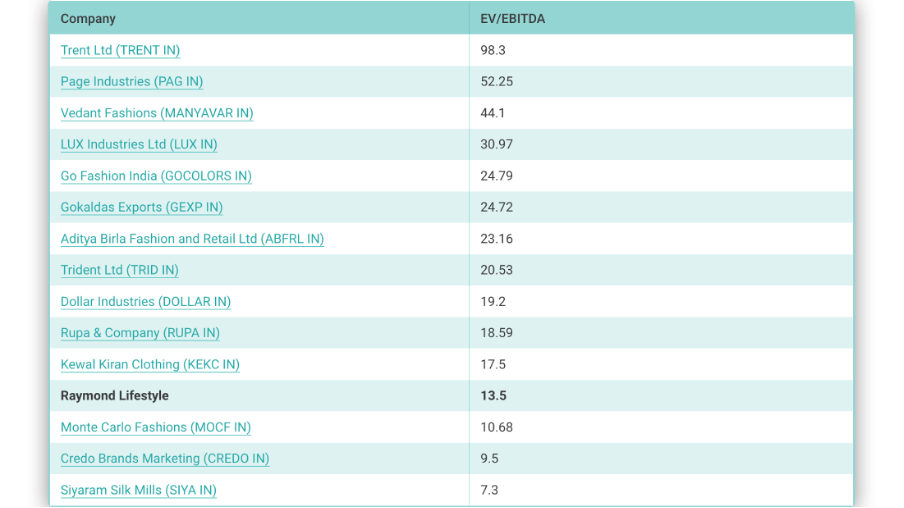
Source: Beat the Street, SmartKarma.com
There are several Questions that come to mind:
1. Is EV/EBITDA a logical choice to compare valuations across the sector? Why?
2. Are the valuations of Existing players higher than long term medians and is that skewing the upwards
3. Even if RLL is undervalued according to the above rational, why does it deserve a re-rating?
Let’s start answering them:
1. Why EV/EBITDA
Enterprise Value = Market Value of Equity (Market Cap) + Market Value of Debt. This is usually used in private deals.
EBITDA is loosely referred to as the operating profit. The Ogs – Warren Buffett & Charlie Munger refer to them as ‘Bullshit Earnings’.
Nonetheless, the metric is commonly used in companies that require relatively large capital Expenditure because in those cases, depreciation and Interest outgo are high and a Price to Earnings multiple may appear absurdly large.
Despite its many limitations, EV/EBITDA is a common metric used to compare the companies above. Just okay. Would not rely on this alone.
2. TO get a sense of whether current valuations are rich in the context of history. A visual Analysis of the chart below (excluding Trent & Page since they were skewing the data upwards) tells us, not much except that the downtrodden lower end companies in this pack converged with the higher valued guys. But again, the period shown is 2020 onwards so anyway, most companies were were trading cheaply during covid.


An EV/EBITDA of 13.5 looks relatively cheap compared to some of the names shown above. But, like we said, we would not rely on the above metrics alone.
A price to book perspective also puts RLL at the bottom of the pack, however, the usefulness of this metric is maybe much lower than an EBITDA multiple. One of the reasons is that book value does represent the ‘value of the brand’ accurately.
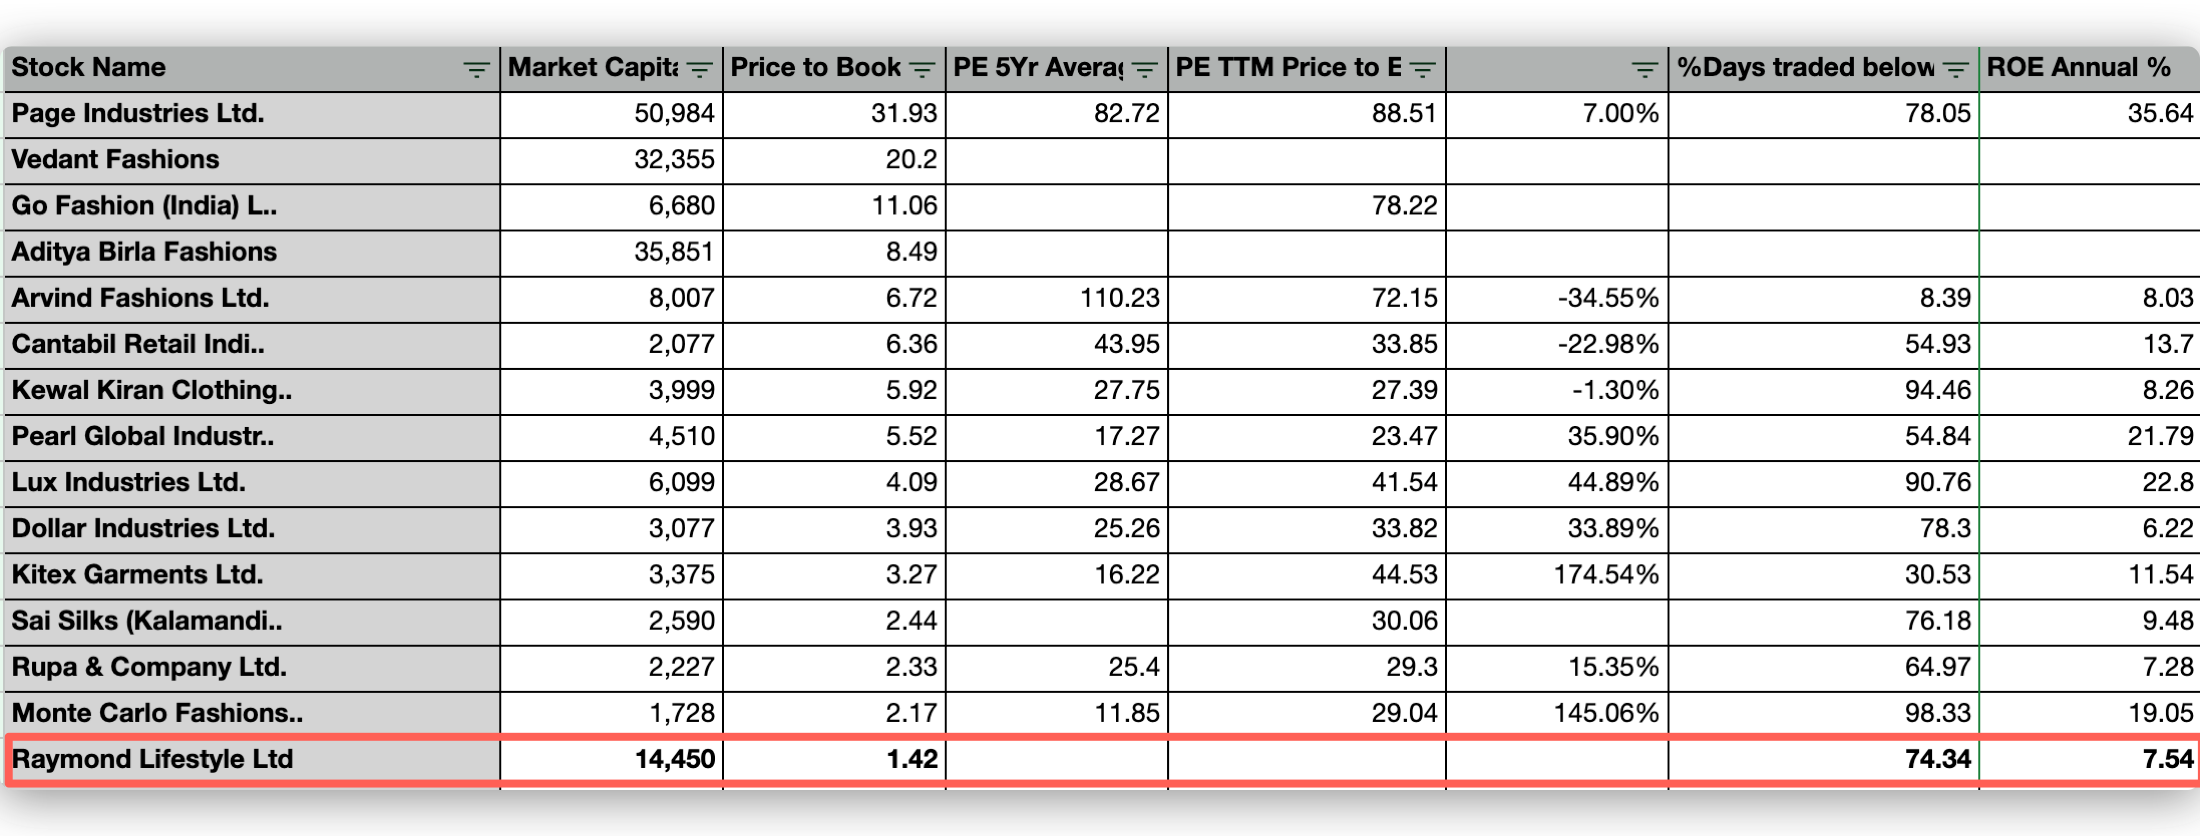
Source: www.screener.in data
Another issue is that RLL tends to do everything in-house and therefore the asset base is much larger vs Sales (for example) than other comparable players such as Vedant Fashions.
For these reasons, P/B has limited if not no use in relative valuations. Nonetheless, it gives a perspective.
No-Growth Model
We could also consider a perpetuity model. Assume PAT Margin for RLL is 10%, which equals around 650 Cr per year. Let’s assume there is no growth. The value of such an asset would be 650/(6.95%) = Rs. 9,500 Cr (6.95% is the current 10-year Govt Bond yield).
This helps us get a sense of what valuations should be if there is no growth in the PAT.
Perhaps the current Market Cap, when seen from this no-growth model reflects the implied expectation that market is not expecting any growth from RLL.
3. Let’s assume it is valued cheap. Why should it re-rate?
This is where the business comes in.
RLL reports 4 segments:
1. Branded Textiles
2. Branded Apparel
3. Garmenting
4. High-Value Cotton Shirting
First, the combined numbers for these segments for FY24.
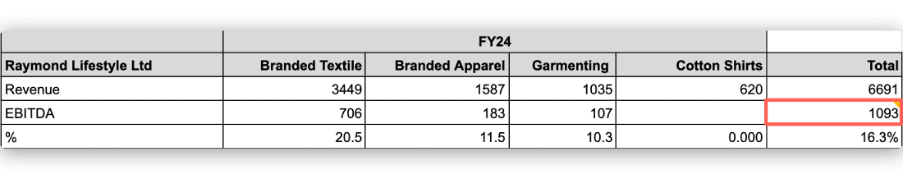
Source: includes 155 Cr other Income.
EBITDA being used by most of these valuations include 1093 Cr number, which by the way I am yet to get from an audited source. Nonetheless, ~1100 Cr EBITDA.
Now, let’s get a context for these segments.
1. Branded Textiles.
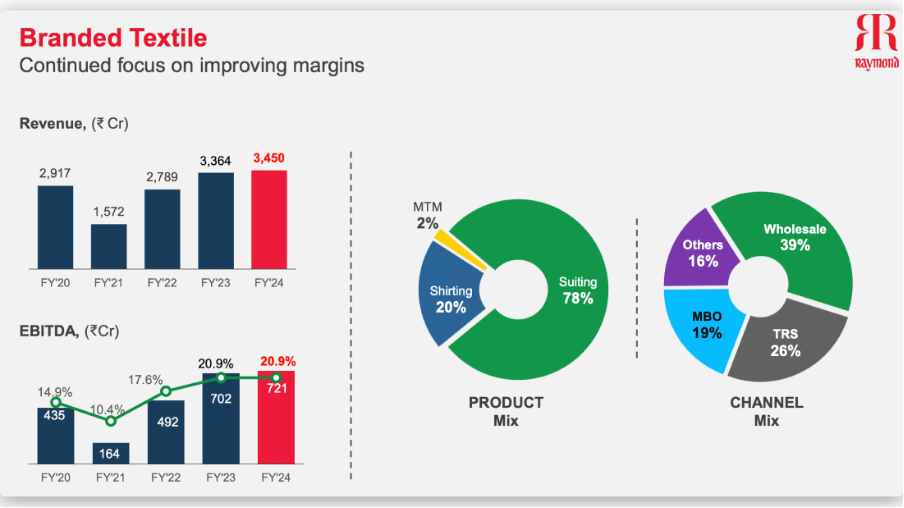
- 5-year Sales CAGR – 3.4%
- EBITDA has improved. Why? Is this sustainable?
2. Branded Apparel

- Sales lower than FY20 sales.
- Massive EBITDA improvement. How? Is this sustainable?
3. Garmenting

- 5-year Sales growth CAGR - 6.2%
- EBITDA Margins – 3X jump. How? Why? Sustainable?
The Bangladesh crisis helped Raymond’s Garmenting segment and they have seen an uptick in “Enquiries” from Clients.
The downer is that there has been almost no Revenue growth on a 5-year basis in the OG RLL segments, however, there has been an EBITDA expansion in almost all Segments. Here’s why.
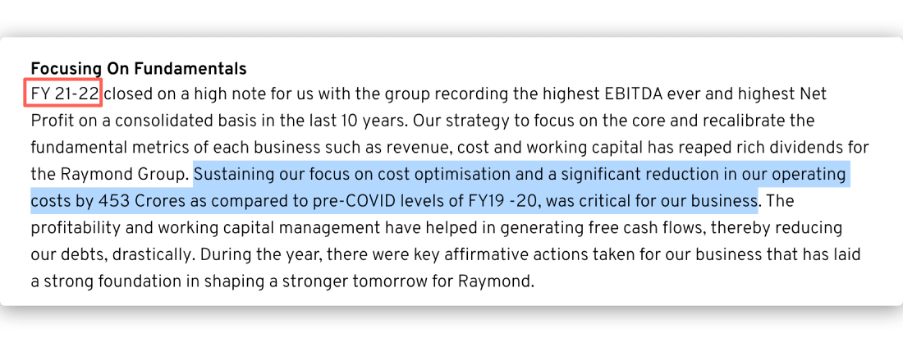
Raymond Limited: Cost Optimization and EBITDA Margin Expansion
Optimizing Costs and Rationalizing Working Capital: RLL optimized costs, closed underperforming stores, and rationalized working capital days. These efforts led to a reduction in working capital days to 76 in FY24, down from over 100 in FY10-20. This was achieved through stringent collection policies and efficient inventory management, resulting in a decrease in receivable days to 52 in FY24 from over 70 in FY10-20.
In FY20, company reported 1638 Stores, whereas in FY24 it had 1518 Stores, up from 1351 from FY22.
In FY22, the company reportedly saved more than 450 Cr in costs.
Asset-Light Franchise Model: RLL is adopting an asset-light franchise model for store expansion. This approach reduces capital expenditure and allows for faster expansion without significantly impacting working capital. The franchise model offers higher gross margins, averaging around 60%.
Enhancing Sourcing Efficiency and Leveraging Scale Benefits: RLL is focusing on enhancing sourcing efficiency and leveraging scale benefits to improve profitability. This includes optimising sourcing channels, negotiating better prices with suppliers, and consolidating purchasing to leverage its size and bargaining power.
The above measures also co-incided with the appointment of the new CEO – Sanjay Kataria in 2022.
Whether these EBITDA Margins will sustain in the near to medium term remains to be seen. We should not get deterred by quarterly numbers for example. In Q1FY25, there was a significant dip in EBITDA margins and even Revenue (Numbers NOT audited).

Source: 12th September Filing from RLL.
However, there is a plausible explanation for the same. Q1 numbers are always a little poor.

Note: Chart above is consolidated number NOT RLL alone so don’t compared margins but focus on dips. The key point is dips in Q1
The key question still remains: Is RLL currently attractively valued?
We have outlined some of the issues with the other metrics used above, EV/EBITDA and Price to book. Based on the feedback from our GIC group meet, I think a better would be to do an SOTP valuation.
A report by Ventura Securities, provides an outline on how to go about the process. This is what it suggests:
Step 1: Regroup Segments in “Wedding” and
Non-wedding”
Step 2: Benchmark against Top Players in the Segment
Step 3: Estimate FY27 EBITDA and use a multiple to project the EBITDA multiple based on the segments.
In step 3, we have not used the forward numbers but instead the trailing EBITDA for conservativeness. Steps 1 & 2, we have nothing to change or add.
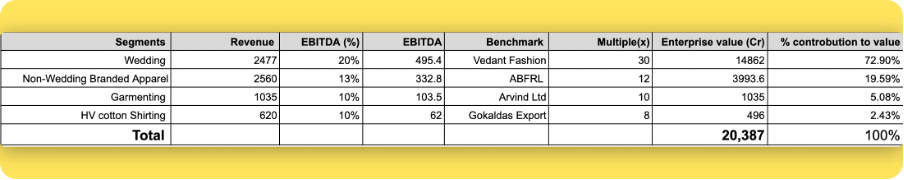
On a trailing EBITDA basis, using a conservative multiple (EV/EBITDA) to benchmarked competitors, RLL is valued around 20,000 Cr.
A summary:
1. EV/EBITDA Multiple of 13.5X may reflect some undervaluation. This valuation implies little to no growth.
2. A more refined approach using EV/EBITDA multiples of various segments of RLL, we get a value of ~ 20,000 Cr. This number is most sensitive to the “Wedding wear” segment multiple of 30X. Since this is done on a trailing basis without any regard to future growth, it reflects a healthy amount of conservatism.
3. A No-growth perpetuity model values the business at around Rs. 10,000 Cr.
4. We have a range of estimates, ranging between 10,000 Cr to 20,000 Cr.
5. Current Market Cap is around 15,000 Cr.
Based on the above, we believe RLL seems to be undervalued in relation to potential future growth If this growth actually pans out. We have not tried to estimate the future growth, leaving the upside optionality almost entirely out of the current estimates.
We have also left the inner-wear/sleepwear segment entirely out of our analysis. That can become a huge optionality.
Additionally, if we account for the new management, most of which has come onboard from FY21-22 onwards, growth prospects of RLL can be fairly attractive. If growth comes, at the estimated 12-15% Revenue and similar or slightly improved EBITDA margin and ROIC remains healthy (15%+), RLL could be an interesting investment story.
Checkout this table. Notice the date of joining. Barring 3 persons, Gautam Singhania and 2 others who joined in 2014 and 2018, everyone else on the management team has joined post January 2021. I’m not genius but I know that when incentivized properly, a fresh management with relevant Industry experience can get things done.

UPDATE 3/12/2024 - Despite all the above, I believe a company with Continued Corporate Governance issues should be bought ONLY at a significant discount. In my view that value would be around 8,000 Cr.
Since Raymond is just one of the ideas available to me, I would prefer allocating my money to other ideas but availability of ideas maybe different Investor to Investor. Please do your due diligence and invest accordingly. This is NOT investment advice.
Thanks for reading.
Rahul
Note: We have relied on data from documents filed by Raymond Ltd and Raymond Lifestyle Ltd. Only in cases where the data was not available, have we used an alternate, but widely used and accepted source of information.
The purpose of this article is only to share interesting charts, data points and thought-provoking opinions. It is NOT a recommendation. If you wish to consider an investment, you are strongly advised to consult your advisor. This article is strictly for educative purposes only.
Rahul Rao has been Investing since 2014. He has helped conduct financial literacy programs for over 1,50,000 investors. He helped start a family office for a 50-year-old conglomerate and worked at an AIF, focusing on small and mid-cap opportunities. He evaluates stocks using an evidence-based, first-principles approach as opposed to comforting narratives.
Disclosure: The writer and his dependents do NOT hold Raymond Lifestyle Ltd Stock Anymore.
Key Sources :
4. Industry Overview (data): https://trendlyne.com/equity/industry/85/other-apparels-accessories/#fundamentals-valuation-and-ratios
5. 4 pages of outstanding litigations in the Information Memorandum, Pages 166 – 170.
https://www.niftyindices.com/Factsheet/ind_Nifty_Smallcap_250.pdf
Hi Rahul, I have looked at this in detail and my process says an initial buying point at 1800 given the kind of one offs and other margins pressures we have seen in Q2.
What I get the feedback on possible q3 is, sales are coming from value side of retail garmenting. Even wedding wears which were getting very expensive, people are trying to buy lower priced wedding wears. Ofcourse there are many levers in RLL, but I see some dent in margins in q3, q4 and hence lower EBITDA etc will lead to first entry point of 1800, and then onwards it starts becoming a value buy with a longer term prospective of getting a good value on all the business verticles. Let's hope for the best. Disclaimer:jin my tracking list, not invested.
So Q2 hasnt been good for them, Vedant and some others have done better. Would that have any impact on your thesis? Wanted to understand how do you think about these variations and incorporate them in your analysis and valuation?