


This Market Leader is doubling capacities.....Fast.
and smart money is buying the stock !

Disclaimer : I hold shares in the company.
Pehle, Aap chronology samhjiye

Styrenix Performance Materials Limited (SPML), originally ABS Plastics Limited, was established in 1973 by Rakesh Agarwal and family.
The co’ ownership changed many times in the past. INEOS Group – the largest Styrene supplier (Styrenix’s Key RM) in the world, bought the co’ from the Agarwal family in 2012.
In an interesting turn of events, the Agarwal family bought back INEOS Group’s 62% stake in the co’ in November 22 and renamed the company Styrenix Performance Materials in January 2023.
In June 2024, the promoters sold a 16.5% stake to repay acquisition-related debt, releasing the pledge on their equity. Reducing promoters stake to 46.2% of SPML's equity.
In December 9th 2024, SPML announced that it has signed a share purchase agreement (SPA) for acquisition of INEOS Styrosolutions (Thailand) for $20 Million from the INEOS Group.
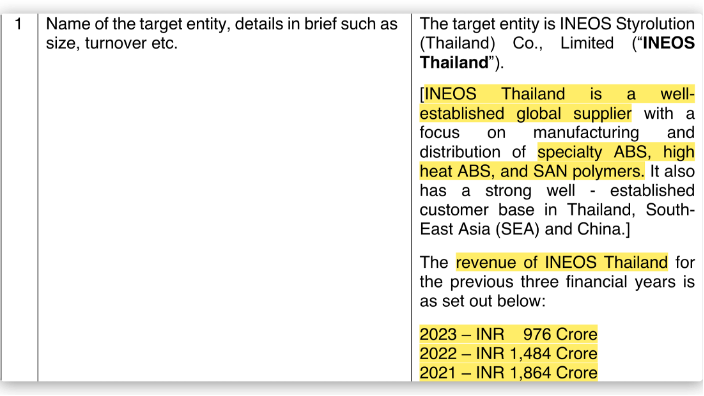
For a business that has the same capacity as SPML - the indian entity, a price tag of $20 Million literally doubles the existing capacities.
Additionally, the new (old?) management, plans to double domestic capacities by FY28. These are major triggers in the biz !
Oh, and Enam Investments, IKIGAI fund (Pankaj Tibrewal) and Vallabh Bhansali recent bought the stock.
Idea Source

I spotted the stock on 14th May 24’ on screener.in. Sunday scroll.
The stock is up 71% since that note. Although, I did not enjoy the entire 71% gain.
Anyway, let’s talk about the business model.
The Business Model
Raw Material 🧪
ABS (Acrylonitrile Butadiene Styrene) & SAN (Styrene-Acrylonitrile), the company’s two key products, need 3 key Raw materials :
1. Styrene – Imported
2. Acrylonitrile – Imported
3. Butadiene – Locally sourced
About 90% of the co’s Raw Material is imported. Bhansali Engg & Supreme Petrochem, two other competitors also import all of their styrene requirements. Basically, there are no styrene capacities in India.
India imported $ 1.1 Billion worth in FY24 and $1.2 billion worth of Styrene in FY23. Because this makes up less than 1% of Total imports I would imagine the incentive to “import substitute” is not very high.
Why doesn’t India make its own Styrene?
Here’s a high-level guesstimate.
The raw materials, like benzene and ethylene, aren’t readily available domestically, and importing them makes production costly. Setting up a styrene plant also requires a huge investment, and with our annual demand at around 1.1 million tonnes, it’s not large enough yet to make it economically worthwhile. On top of that, global suppliers from countries like Taiwan and South Korea offer styrene at competitive prices. Regulatory hurdles and environmental concerns add to the challenge.
But there’s hope—Indian Oil Corporation (Panipat) is stepping up with plans to build a styrene monomer plant by 2026-27, aiming to reduce our reliance on imports.
FYI I recently drove past the panipat refinery on NH44. It stinks like anything. Next time I’ll go checkup on the styrene plant :)
Plants & Locations

According to the management (Q2FY25. P16), the ABS demand in FY24 was around 320,000 TPA. The company sold 85,000 TPA in FY24. That’s about 25% Market share.
This means that the other player Bhansali Engineering makes up for the other 20% or so. It has a capacity of 75,000 TPA. Supreme Petrochem, the latest entrant is also setting up capacity of 75,000 TPA by March 2026. All domestic players make up about 45% of the ABS sold in India.
The remaining 55% is imported. Of this ~55%, about 50% of imports (or ~93% of the imported ABS) are from Taiwan and South Korea.
Capacity Expansion
It is evident that all 3 players (Supreme Petrochem is the newest entrant) are expanding local capacity. This kind of makes sense because existing local capacities cater only about 45% of the Total demand, which itself is growing, leaves room for “Import substitution”.
Styrenix plans to expand capacity in the ABS and PS division as outlined below. In October 23 they announced a plan to de-bottleneck existing capacities by October 24, which is done.

This “de-bottlenecking” increased capacities by 30-50%. INEOS Group, a large conglomerate just wasn’t focused it seems. Since the Agarwal family took over they’re optimising costs like anything and this de-bottlenecking is a testament to those efforts.
Not to mention, they cut Auditor costs from 40L per year to 15L. I like these guys.
Customers’ & Industries served
Basically ABS & SAN is plastic. But not like the basic polyethylene Bull-shit kind of plastic. Next time a guy on a bike hits your Rear view mirror, think ABS !
Don’t get overwhelmed with the names but here’s a quick list of the co’s products and where they are used eventually. This is not an exhaustive list. Each product has many more applications.

But the overwhelming amount of the co’ products are used in Auto & consumer white goods (AC, Fridges etc). Auto sector is cyclical, which means sales are likely to be cyclical. This is the achilles heel in this story. More on this later.
And here’s a screenshot from their Investor presentation, deluding themselves that Auto sales will recover in Q4FY25. 4W passenger inventory is at an all time high. Discounting is at a high. I recently bought a new car at decent discount of 1.5 Lac.

Switching Cost / Value Addition
How difficult it is to make or deliver a product is directly proportional to the “competitive advantage” a company enjoys. On that point, here is some evidence that may hint towards such an advantage.
First, here’s a few words from a Credit rating report from CARE Rating dated 19th December 2024.
“…Styrenix Performance Materials Limited (SPML) continue(s) to derive strength from its established and long track record of operations, leadership position in the domestic Acrylonitrile Butadiene Styrene (ABS) and Styrene Acrylonitrile (SAN) co-polymer markets with focus on customised speciality products, established position in the Polystyrene (PS) markets…”
Second, here’s a few interesting words from Bhansali Engineering (FY24 AR – P39) - “ABS is a performance polymer and its grades are specially developed for specific application required by the customers. This is precisely the reason that the Company has adopted the policy of focusing more on speciality grades which requires stupendous efforts in the beginning, but once developed, those efforts are highly rewarding not only in terms of price but also perpetual business with the customers due to the position acquired in the supply chain established by the customer”
Speciality ABS & SAN is key to higher margins.
The product superiority is a function of matching the customer very specific requirements in terms of colour, properties – Heat, UV, rigidness, strength, and colours. Styrenix has developed 1300+ colours and Bhansali boats 1500+ Colors.

Does this show up in Margins?
Since 2014, Bhansali did better margins than Styrenix (formerly INEOS Styrosolution)

There are 2 notable observations from this chart :
1. The Agarwal family sold ABS business in 2012. It seems the INEOS could not the business as efficiently and starting 2016 onwards its margins began lagging those of Bhansali. With the change of ownership back to Agarwal family, this trend might get reversed. We’re already seeing aggressive cost optimisation over the last 2 years in the business.
2. Margin volatility is evident. 2019 & 2020 were the bottom years and margin contraction was severe. These were also the years when the Auto sales were suffering and the economy generally was getting slowed down. FY21-22 were aberrations because of the supply chain disruptions across the world. FY22-24 have been good years for the economy and it shows in the margins. The last 2 quarters the GDP growth has slowed and 4W sales has flatlined and even 2W have slowed down. What comes next?
3. However you look at it, the margin stability is lacking. This is because margins depend largely on the spread between Styrene & ABS & SAN. Styrene is a downstream product of crude oil. It’s prices are linked to crude which fluctuates wildly. The prices of ABS & SAN also fluctuate wildly and while contract based sales have a clause to pass on the price varying with a slight lag, the price itself is market driven.
Why OPM is NOT stable
The styrene-ABS spread—the price difference between styrene monomer and Acrylonitrile Butadiene Styrene (ABS)—is a crucial indicator of profitability for ABS producers. This spread is influenced by various factors, including raw material costs, supply-demand dynamics, and market conditions.
Here are some examples of how these factors play our in real-life
2021 Texas Winter Storm (February 2021)
The winter storm Uri caused widespread shutdowns of petrochemical plants in Texas
Multiple styrene facilities were forced to declare force majeure, including LyondellBasell and INEOS Styrolution
This led to an immediate spike in styrene prices
However, ABS prices rose even more sharply because:
ABS plants also shut down, creating tighter supply
Strong downstream demand from electronics and appliances continued
The supply chain was already tight from COVID-related disruptions This resulted in the ABS-Styrene spread widening significantly during Q1-Q2 2021
Russia-Ukraine conflict (2022),
During the Russia-Ukraine conflict (2022), crude oil prices surged due to supply disruptions and geopolitical tensions. This increased the cost of ethylene and benzene, key raw materials for styrene production, driving up styrene prices.
Impact on Spread: ABS producers faced shrinking margins as higher styrene costs squeezed the styrene-ABS spread unless ABS prices also rose to match.
Financials
Income Statement & Cash Flows

1. Sales Growth : Not consistent. Perhaps a better measure is volume growth.
2. GPM : Wild fluctuation between 14.8% & 42%. Both of which are aberrations. If GPM is a signal for value addition, a 20-25% GPM does not seem to be very encouraging.

3. OPM : Described above in detail.
4. PAT to CFO conversion : The cumulative CFO of Rs. 1560 Cr vs Rs. 1171 PAT is indicative of sufficient cash conversion.
5. Free Cash Flow : Rs. 1152 – Cumulative Interest (Rs 114 Cr) = Rs 1038 Cr. However, notice that the bulk of the FCF was earned in the last 4 years, a period during which margins were higher than the pre-2019 period. Reasons for the same must be checked to estimate whether this is likely to continue.
Debt Free.
Working Capital Ratios

It seems inventory as a percentage of sales were elevated between FY17-FY21. INEOS Group (the previous owner) was holding higher inventory than possibly required.
Receivables to sales seem to be largely stable. No surprises here.
Fixed Asset Turnover

This metric is useful because it tells us how much every Rs of Net fixed Assets can generate in sales. NFAT of 6-7 is encouraging because it means the co’ can invest 500 Cr and theoretically get 3,000 Cr to 3,500 Cr of Sales.
FYI this is exactly what Styrenix is planning to do by FY28. The execution, utilisation and margin fluctuations notwithstanding, Styrenix’s plan to invest Rs 650 Cr to increase capacities is likely to 2X sales from current levels at full utilisation of the planned capacities.
Profitability Ratios
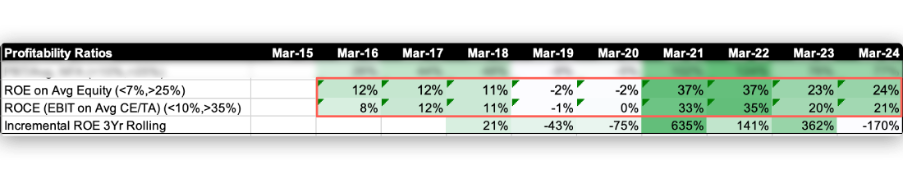
In the last 10 years, the co has undergone 4 phases. FY16-18, FY18-20, FY21-22, and the last 2 years. Profitability differences in these periods are distinctly visible in the colour scales above.
Valuations
Price to Book value: At 6X price to book value, valuation is way above median of 2X.

This possibly reflects bullish prospects under the new management. Still, at 3 times the median, I’m not particularly excited about buying at current valuations. Another possible explanation could be that hefty dividends have been extracted from the company since FY22.
Book value was 871 Cr in FY21, and it is Rs 721 Cr today. Despite healthy cash flow accretion, the same has not flowed been reinvested in the business. The co’ has declared dividends of close to 700 Cr since FY22. Perhaps, for that reason Price to book value as it currently stands is not the best metric because if 700 Cr had been added to the book value, it would be nearly double of what it is and the price to book would be 3X not the 6X it currently is. That would still be expensive but not by a wide margin as is the case right now.
Yet another perspective could be that even with no change in ABS spread, if volume doubles in the next 3-4 years, we could see PAT more than double owing to Opex.
Obviously, an opinion on valuations require a deeper look.
That’s about it dear investor.
The Million dollar question (Tracking points)
How dependent is Styrenix on the Auto sector doing well?
What are the Key Drivers of ABS/SAN – Styrene spreads which ultimately determine margins?
Are ABS – Styrene spreads at the bottom of the cycle?
How did the co’ acquire INEOS Thailand at throwaway prices? For the same capacity as India, it paid just about $20 Million. What are we missing here?
You can also watch the Full video here on our Youtube :)
Don’t forget to share. AND Subscribe.
Rahul Rao
CFA
B.Eng - Aeronautics
Note: We have relied on data from www.Screener.in and www.tijorifinance.com throughout this article. Only in cases where the data was not available, have we used an alternate, but widely used and accepted source of information.
The purpose of this article is only to share interesting charts, data points and thought-provoking opinions. It is NOT a recommendation. If you wish to consider an investment, you are strongly advised to consult your advisor. This article is strictly for educational purposes only.
Rahul Rao has been Investing since 2014. He has helped conduct financial literacy programs for over 1,50,000 investors. He helped start a family office for a 50-year-old conglomerate and worked at an AIF, focusing on small and mid-cap opportunities. He evaluates stocks using an evidence-based, first-principles approach as opposed to comforting narratives.
Disclosure: The writer and his dependents hold the stocks/commodities/cryptos/any other asset discussed in this article.
Great article Rahul!
Great article Rahul. Your video is also pretty detailed. Way to go. Appreciate if you can keep updates flowing on the origianl thesis. Here is what I found in Jan'25 concall.
100kt ABS capacity which was due for FY28 is now pre-poned. 50kt (50%) will be online in FY26. Balance will be ahead of schedule (FY27 is my assumption). On polysterene, they are upping the capacity forecast from 65kt to 100kt and with an outlook of taking it to 150kt.